The Hidden Cost of Email Deliverability Failures for Enterprises

Quick Answer
What CFOs and IT Leaders Need to Know About the ROI of Email Authentication In August 2025, IBM released the 20th-anniversary edition of the Cost of a Data Breach Report, based on research conducted by Ponemon Institute across 600 organizations and 3,470 security and C-suite interviews. The headline was not what most commentators expected.

What CFOs and IT Leaders Need to Know About the ROI of Email Authentication
TL;DR
- US breach costs just hit an all-time record of $10.22 million - a 9% year-over-year increase, even as global breach costs dropped 9% to $4.44 million (IBM Cost of a Data Breach 2025). US organizations are paying more, not less, for email-delivered threats.
- Phishing is the #1 attack vector by both frequency and cost - 16% of all breaches, $4.8M average per incident (IBM 2025). Three of the top four most expensive attack vectors are email-delivered.
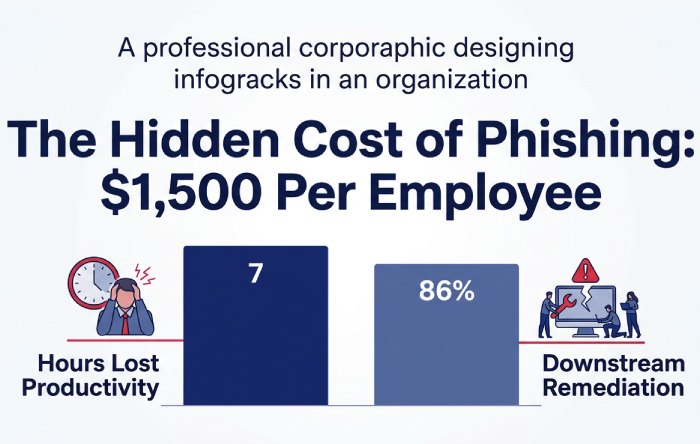
- Phishing costs roughly $1,500 per employee per year even without a breach - $14.8M annually for large US companies, with 7 hours of wasted productivity per employee (Ponemon 2021). Multiply by your headcount.
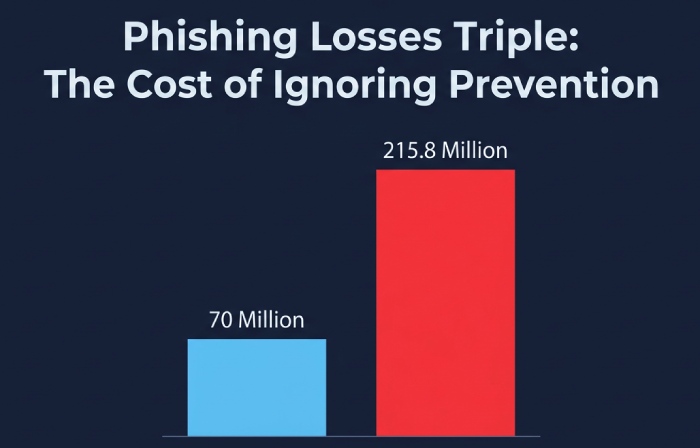
- BEC losses hit $2.77 billion in 2024 and phishing damages TRIPLED in 2025 from $70M to $215.8M in a single year (FBI IC3 2024; IC3 2025). Recovery ceilings are fixed; prevention isn’t.
- Authentication multiplies inbox placement by 2.7x - the single strongest driver of deliverability, contributing +38.6 points to inbox placement rates (Fortra Q2 2025). At $36-$40 revenue per $1 of email marketing spend, this is a direct line-item multiplier.
- 32% of breaches result in regulatory fines and 48% of those fines exceed $100,000 (IBM 2025). PCI DSS 4.0, GDPR, and HIPAA are now enforcing this risk with teeth.
- The fix has a known cost. Clean SPF, deployed DKIM, and DMARC at enforcement. The ROI section below shows how the numbers work for a typical enterprise.
1. The $10.22 million email: what the flagship breach data actually says
In August 2025, IBM released the 20th-anniversary edition of the Cost of a Data Breach Report, based on research conducted by Ponemon Institute across 600 organizations and 3,470 security and C-suite interviews. The headline was not what most commentators expected. The global average cost of a data breach fell for the first time in five years, dropping 9% to $4.44 million - but the US number went in the opposite direction. US breach costs hit $10.22 million on average, a 9% year-over-year increase and an all-time record for any country or region.
Two forces explain the US divergence: higher regulatory fines and higher detection/escalation costs. In 2025, 32% of data breaches resulted in regulatory fines, and 48% of those fines exceeded $100,000 - with 22% exceeding $250,000 (IBM 2025). PCI DSS 4.0 took full effect March 31, 2025 with mandatory DMARC requirements. GDPR fines continue to compound. HIPAA enforcement is intensifying. For US organizations, the regulatory exposure now exceeds the containment cost for many breach categories.
Inside the breach data, the attack-vector breakdown is the part a CFO should read twice. Phishing is the #1 initial attack vector at 16% of all breaches, averaging $4.8 million per incident. Third-party vendor and supply chain compromise - most of which arrives by email - is #2 at 15% and $4.91 million average. Malicious insiders (often facilitated by credential-phishing) top the cost ranking at $4.92 million (IBM 2025). Three of the four most expensive attack categories are email-delivered. This is not a diversified threat landscape; it is an email-authentication problem wearing different labels.
“Phishing isn’t one of several threats. It’s the single largest entry vector into modern enterprises - and the category email authentication is specifically designed to stop.”
What it means: If you benchmark your security spend against the attacker’s actual delivery channel, email authentication is the highest-leverage control available. The dollars at risk per breach are already documented. The only question for CFOs is whether the prevention cost is a fraction of the incident cost - and as we’ll show in the ROI section below, it’s less than 1%.
2. The $1,500-per-employee cost you’re already paying
Most CFOs think of phishing cost as a breach-event number - a one-time $4.8M hit if you’re unlucky. That framing undercounts the annual baseline that every organization pays whether or not a breach occurs. Ponemon Institute’s 2021 Cost of Phishing Study - still the most granular per-employee decomposition available - found that large US companies lose an average of $14.8 million annually to phishing, up from $3.8 million in 2015. That breaks down to roughly $1,500 per employee per year.
Where does the money go? The single largest cost is lost productivity: each employee wastes an average of 7 hours per year dealing with phishing - examining suspicious messages, reporting them, recovering from successful ones. For a 10,000-employee organization, that’s 70,000 hours of lost work. At an average labor rate of $49.50/hour, Ponemon estimates the productivity loss alone at $3.2 million annually for a typical enterprise (Ponemon 2021).
The BEC decomposition is even more striking. Business Email Compromise costs large organizations an average of $5.96 million annually, but the extrapolated maximum-loss scenario reaches $157 million if an organization is unprepared (Ponemon 2021). The ransomware reframing is equally important: ransomware annually costs large organizations $5.66 million, but the paid ransom is only $790,000 of that - 14% of the total. The other 86% is downstream remediation: incident response, forensics, legal, customer notification, regulatory response, lost business.
The CFO math that matters: Multiply your total headcount by $1,500. That is your approximate annual phishing cost floor before any breach. For a 5,000-person enterprise, it is $7.5 million every year. For a 20,000-person enterprise, it is $30 million every year. This is not a theoretical worst case; this is Ponemon’s measured average. And this cost exists whether your board has approved a cybersecurity budget increase or not.
“The question isn’t whether to invest in email authentication. The question is whether you’d rather pay $1,500 per employee per year in productivity loss and breach risk - or a fraction of 1% of that to fix the underlying authentication posture.”
3. The government data: $8.5 billion in BEC losses, and the trajectory is up
For skeptics who discount vendor-sponsored research, the US government’s numbers tell the same story with different methodology. The FBI’s Internet Crime Complaint Center aggregates actual victim complaints, not survey responses. The IC3 2024 Annual Report documented $2.77 billion in BEC losses across 21,442 incidents in 2024 - making BEC the second-costliest cybercrime tracked, behind only investment fraud. Across 2022-2024 combined, BEC losses reached nearly $8.5 billion.
The 2025 IC3 data - released in April 2026 - documents an accelerating trajectory. Total cybercrime losses hit $20.877 billion in 2025, a further 26% increase on top of 2024’s 33% jump. More pointedly for email-authentication arguments: losses from phishing/spoofing complaints alone tripled year-over-year, from $70 million in 2024 to $215.8 million in 2025. When direct phishing damages triple in a single year, the risk model any CFO is working from is already out of date.
The recovery data closes the loop on why prevention is the only economically rational posture. The FBI IC3 Recovery Asset Team recovered $561.6 million in frozen funds in 2024 - a 66% success rate on attempted recoveries. That is the federal government’s best post-incident performance, operated through the Financial Fraud Kill Chain with banking-sector cooperation. Even at that ceiling, $16 billion remained unrecovered. The asymmetry is fundamental: prevention has no ceiling; post-incident recovery does.
What it means: If your risk-management posture relies primarily on cyber insurance or law-enforcement recovery, you are anchoring to the 66% success rate - and only for the subset of incidents that reach federal-level attention. The other 33%+ of attempted recoveries fail outright, and the overwhelming majority of BEC losses are never reported to IC3 at all. Prevention-layer controls - starting with SPF, DKIM, and DMARC at enforcement - are the only interventions that scale economically against the full risk surface.
4. The revenue leak nobody is measuring: 16.9% of your email never arrives
The breach-cost literature dominates cybersecurity conversations. But for enterprises that send high volumes of transactional or marketing email - billing, renewals, onboarding, customer retention - the revenue leak from poor deliverability is often larger than the breach-risk exposure. And this leak is rarely on any budget owner’s dashboard.
The baseline number from Validity’s 2024 Global Deliverability Benchmark: the average inbox placement rate across 15 major email service providers was 83.1% in 2024. That means roughly 1 in 6 legitimate emails never reaches an intended inbox. For an enterprise sending 1 million emails per month across marketing, transactional, and service notifications, that is 169,000 missed touchpoints every month - renewals that don’t convert, billing notifications that trigger failed autopay, onboarding sequences that never start.
The relationship between email authentication and inbox placement is not subtle. Fortra’s Q2 2025 analysis found that fully authenticated domains (SPF + DKIM + DMARC) achieve 2.7x higher likelihood of inbox placement compared to unauthenticated senders. Authentication is now the single strongest driver of deliverability, contributing +38.6 percentage points to inbox placement rates - ahead of infrastructure, ESP selection, and content factors combined.
Why did this become so pronounced in 2024-2025? Because Google and Yahoo rolled out mandatory authentication for bulk senders in February 2024, and Microsoft matched them in May 2025 (ESP Q1 2024-2025 tracking). The three largest global email providers now filter unauthenticated mail aggressively. Even paying ESP customers saw their deliverability collapse: Mailgun’s inbox placement dropped 27.75 percentage points between Q1 2024 and Q1 2025. MailChimp fell from 51.93% to 32.30% over the same period. These are platform-wide declines that affect every customer using shared infrastructure, regardless of individual sending practices.
The deliverability ROI math
Email marketing delivers $36-$40 in return for every $1 invested - approximately 3,500% ROI - which makes inbox placement one of the highest-leverage optimizations available to any enterprise (Validity benchmark). That multiplier cuts both ways. Every point of deliverability you gain or lose moves revenue proportionally. The table below shows what authentication-driven inbox-placement gains look like at enterprise scale.
| Monthly email volume | Emails missed at 83% placement | Emails gained at 95%+ (authenticated) | Annual revenue recovered* |
|---|---|---|---|
| 100,000 emails/month | 17,000/month | +12,000/month | ~$43,200/year |
| 1,000,000 emails/month | 170,000/month | +120,000/month | ~$432,000/year |
| 10,000,000 emails/month | 1,700,000/month | +1,200,000/month | ~$4,320,000/year |
* Assumes $0.003 revenue per delivered email (conservative blended transactional/marketing assumption at $36-per-$1 ROI). Individual enterprise numbers vary; use your own average revenue-per-email figure.
What it means: For a mid-market enterprise sending roughly 1 million emails monthly, moving from the 83% industry-average deliverability to the 95%+ achievable with clean authentication recovers approximately $432,000 per year in otherwise-lost email-attributable revenue. Against the cost of deploying SPF flattening, cleaning DKIM, and progressing DMARC to enforcement - typically under $30,000 for the first year including tooling - the first-year ROI exceeds 14x before any breach-risk reduction is counted. The breach-risk reduction is the bonus.
5. The silent tax on ‘authenticated’ domains: SPF lookup failures
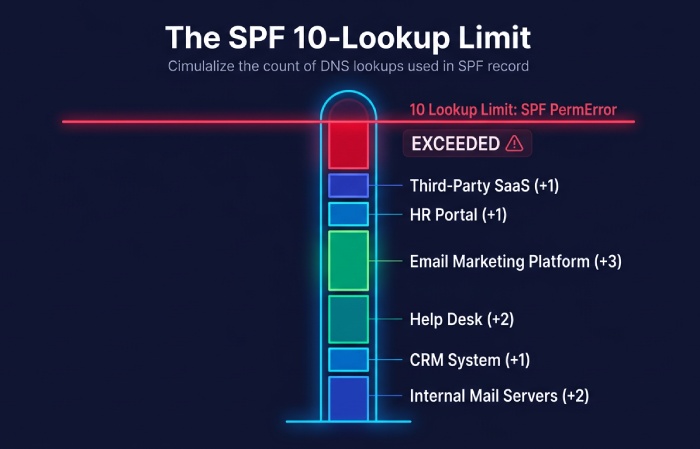
Here is the failure mode most enterprises don’t see until after it starts costing them. SPF - the oldest of the three authentication protocols - has a little-known constraint in RFC 7208: your SPF record cannot require more than 10 DNS lookups to evaluate. Every include:, a, mx, and redirect mechanism counts against the ceiling. Exceed it, and SPF returns a PermError. DMARC, which depends on SPF-with-alignment or DKIM-with-alignment passing, then loses half of its authentication basis. A domain at p=reject with broken SPF starts rejecting its own legitimate mail. A domain at p=none silently lets spoofed mail through.
This is not a theoretical concern. A typical enterprise today authorizes SPF includes for marketing automation, transactional email (SendGrid, Mailgun, Postmark), HR platforms, CRM (Salesforce, HubSpot), helpdesk (Zendesk, Freshdesk), ERP notifications, CDN mail relays, and security vendors. Each vendor’s SPF include consumes 1-3 lookups because includes nest. A growing enterprise hits the 10-lookup ceiling roughly when it adopts its third major SaaS platform.
The result is an enterprise that appears authenticated on paper but fails authentication in practice. Fortra’s 2025 analysis found that even among senders who publish DMARC records, only 37% use enforcement policies (p=quarantine or p=reject). The remaining 63% sit at p=none - visibility without protection. A significant portion of that 63% is organizations that tried to move to enforcement, discovered their SPF was broken, rolled the policy back, and never returned.
What it means: Before you budget for authentication improvements, audit your current SPF record with a tool that counts nested DNS lookups, not just visible mechanisms. If you are at 8 or above, you are one vendor away from silent DMARC failure. SPF flattening - resolving nested includes into a compact, IP-based record that stays under the 10-lookup ceiling - is the specific fix. Services such as AutoSPF streamline this procedure by regularly simplifying and refreshing SPF records. This ensures that lookup errors are minimized and DMARC alignment is consistently upheld across a large scale. Because vendor IP pools change weekly, the refresh has to be automated. This is the least glamorous line item in any email-security budget and also the one that determines whether the rest of the budget works.
6. Brand and trust costs: the line items that don’t show up as line items
Every cost line we’ve discussed so far is documented in vendor or government research. There is a class of costs that is harder to quantify but consistently larger than the line-items suggest: brand and trust damage.
The consumer-side data is stark. Stripo’s deliverability research found that 10% of consumers lose trust in a brand if they see that brand’s emails in the spam folder, and nearly 33% of recipients feel actively disappointed when marketing messages land in spam. When your authentication is broken, your recipients don’t see a technical failure. They see you being unprofessional.
IBM 2025 breach data documents the enterprise-side version: the average cost of lost business from a breach was $1.30 million per incident in 2025 - including revenue from system downtime, lost customers, and reputation damage. That number sits alongside detection and escalation costs ($1.47M average) and post-breach response costs ($1.20M average) as the three largest categories inside the breach-cost aggregate. Lost business is not a soft cost; it is roughly a third of the total.
The trust damage compounds. IBM also found that 65% of breached organizations had not fully recovered at the time of survey. Among those that had recovered, 76% said recovery took longer than 100 days, and 26% required more than 150 days. “Recovery” in this definition includes re-establishing customer confidence and employee trust - which, unlike technical remediation, doesn’t close out on a patch-Tuesday deadline. It takes quarters, sometimes years, and it shows up in churn, win-rate, and Net Promoter scores long after the incident-response retrospective is filed.
“The ‘lost business cost’ of a breach - roughly a third of the total damage - is not on the security team’s P&L. It’s on the CFO’s. That’s the part that takes years to recover.”
7. The 90-day ROI path: what to actually do
The business case for email authentication is not difficult once the numbers are in front of you. The question is operational: what sequence of actions converts the research above into measurable risk reduction and revenue recovery? The answer is the same for a 500-person company and a 50,000-person enterprise; only the scale of the effort differs.
Days 1-30: Measure the gap
- Run an SPF lookup audit across every sending domain. Use a tool that counts nested DNS lookups, not just visible mechanisms. If any active domain is at 8 or higher, flatten it before doing anything else. Most enterprises discover at least one domain in PermError that they didn’t know about.
- Inventory every sending source. List every SaaS platform, vendor, and internal system that sends email on your behalf. Typical enterprises discover 30-60+ legitimate senders they hadn’t documented. Each one is a potential DMARC alignment issue.
- Publish DMARC at p=none on every active domain - including parked domains. Attackers prefer unmonitored domains for lookalike spoofing. Adding a p=none record with an rua= reporting address costs nothing and gives you visibility into impersonation attempts immediately.
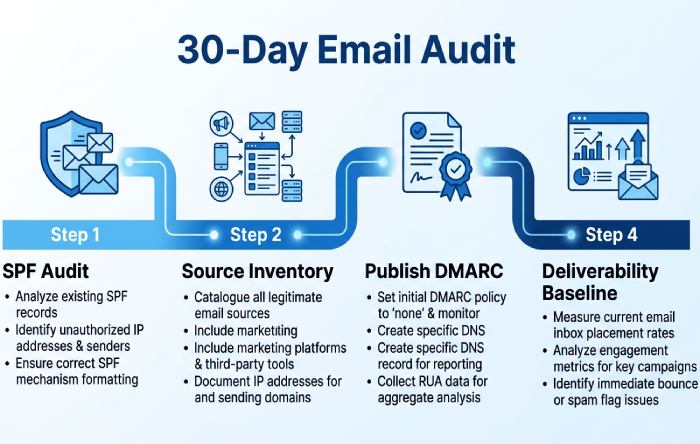
- Calculate your current deliverability baseline. Most enterprises have never measured actual inbox placement - they measure delivery (accepted by receiving server), which is not the same thing. A deliverability audit across Gmail, Microsoft, and Yahoo quantifies the current revenue leak in concrete dollars.
Days 31-60: Fix the plumbing
- Flatten SPF. Resolve nested includes into an IP-based record under the 10-lookup ceiling. Automate the refresh cycle - vendor IP pools change weekly, so static flattening breaks within a month.
- Enable DKIM signing on every sending source. For each vendor identified in step 2, configure DKIM with your domain as the signing domain (d=), not the vendor’s. This is the step most enterprises skip; it is also the step that makes DMARC enforcement feasible when SPF breaks.
- Delegate bulk mail to subdomains. Marketing, transactional, and HR should each send from their own subdomain. This isolates reputation, allows differentiated DMARC policies, and protects the primary domain if any single vendor fails.
- Wire DMARC aggregate reports to a parser. Raw XML reports are unusable at scale. Use a DMARC analysis platform to categorize senders automatically. Without this, steps 5-7 are invisible.
Days 61-90: Move to enforcement
- Move to p=quarantine with pct=10. DMARC’s pct tag lets you apply the policy to a percentage of failing mail. Start small. Monitor aggregate reports daily for legitimate senders you didn’t know about.
- Ramp the percentage. pct=10 → 25 → 50 → 75 → 100. Each step should run for 2-3 weeks with no legitimate-mail failures before advancing. Complex sending environments take 90-180 days; simpler ones move faster.
- Move to p=reject. At p=reject with pct=100, receiving servers silently drop mail that fails DMARC alignment. This is the only posture that actually prevents domain spoofing. By this point, aggregate reports should show 99%+ alignment on legitimate mail.
- Report the ROI. Measure inbox placement rate before and after. Measure the delta in bounces, spam-folder placement, and engagement. Convert to revenue using your actual revenue-per-email figure. This is the number the CFO remembers at budget time.
8. Bottom line: the single CFO number
Out of the 27 statistics cited in this article, one number captures the CFO case for email authentication more cleanly than the rest. It is the ratio between what an authenticated domain earns and what an unauthenticated one loses: 2.7x. That is the multiple by which fully authenticated domains outperform unauthenticated ones in inbox placement (Fortra Q2 2025). Applied to the email-marketing ROI benchmark of $36-$40 returned per $1 spent, authentication effectively multiplies the return on every email-marketing and transactional-email dollar your organization spends.
Set that next to the breach-side data: $10.22 million average US breach cost, $4.8M average phishing-initiated breach, $1,500 per employee per year in ambient phishing cost, $215.8 million in direct phishing losses in 2025 (triple the 2024 figure), and a regulatory fine exposure that already hits 32% of breaches. The prevention side of the ledger costs a fraction of 1% of any of those numbers.
The 2024-2025 regulatory cascade - Google, Yahoo, Microsoft, PCI DSS 4.0 - has removed the last economically rational reason to wait. Every organization that processes payments, sends commercial email, handles federal data, or operates in a regulated market is now subject to at least one DMARC mandate. The choice is no longer whether to deploy authentication; it is whether to do it proactively, capturing the deliverability ROI along the way, or reactively after a breach or a deliverability collapse forces your hand. The reactive path costs the $10.22 million figure at the top of this article. The proactive path costs less than most enterprises spend on a single trade-show booth.
If you take one number into your next budget meeting, take this one: the average US breach cost increased 9% in 2025 while the global average fell 9%. That divergence is the story. US organizations are paying a growing premium - driven by regulatory fines and detection costs - for email-delivered threats that have been preventable with well-understood technology for the better part of a decade. The technology is still well-understood. What changed is the price of ignoring it.
References
Every statistic in this article is sourced from a publicly accessible primary-source document - IBM / Ponemon Institute research (the 20-year benchmark for cybersecurity economic impact), FBI IC3 annual reports (the authoritative US government tally of cybercrime financial losses), the FTC Bureau of Consumer Protection (regulatory standard-setter for email authentication), Microsoft’s Digital Defense Report 2025 (telemetry from 5 billion daily emails), and industry deliverability benchmarks from Validity, Fortra, and EmailToolTester. All URLs are written out in full so attribution survives format conversion.
- IBM Cost of a Data Breach Report 2025. https://www.bakerdonelson.com/webfiles/Publications/20250822_Cost-of-a-Data-Breach-Report-2025.pdf
- Ponemon Institute 2021 Cost of Phishing Study. https://www.proofpoint.com/us/resources/analyst-reports/ponemon-cost-of-phishing-study
- FBI IC3 2024 Internet Crime Report. https://www.ic3.gov/AnnualReport/Reports/2024_IC3Report.pdf
- FBI IC3 2025 Internet Crime Report. https://www.ic3.gov/AnnualReport/Reports/2025_IC3Report.pdf
- FTC Bureau of Consumer Protection: Businesses Can Help Stop Phishing. https://www.ftc.gov/system/files/documents/reports/businesses-can-help-stop-phishing-protect-their-brands-using-email-authentication-ftc-staff/email_authentication_staff_perspective.pdf
- Microsoft Digital Defense Report 2025. https://cdn-dynmedia-1.microsoft.com/is/content/microsoftcorp/microsoft/msc/documents/presentations/CSR/Microsoft-Digital-Defense-Report-2025.pdf
- Microsoft Digital Defense Report 2025 - CISO Executive Summary. https://cdn-dynmedia-1.microsoft.com/is/content/microsoftcorp/microsoft/bade/documents/products-and-services/en-us/security/CISO-Executive-Summary-MDDR-2025.pdf
- B2B Email Deliverability Report 2025 (Fortra Q2 2025 data). https://thedigitalbloom.com/learn/b2b-email-deliverability-benchmarks-2025/
- MailReach 2025 Email Deliverability Statistics (Validity/EmailToolTester benchmark). https://www.mailreach.co/blog/email-deliverability-statistics
- Email Deliverability Tool Statistics 2026 - ESP Q1 2024-2025 data. https://mailmend.io/blogs/email-deliverability-tool-statistics
- Stripo.email Deliverability Statistics Report. https://stripo.email/blog/inbox-placement-matters-deliverability-stats/
Topics
General Manager
Founder and General Manager of DuoCircle. Product strategy and commercial lead for AutoSPF's 2,000+ customer base.
LinkedIn Profile →